{ "@context": "https://schema.org", "@type": "SoftwareApplication", "name": "eSTZwritR", "alternateName": "easy rider", "applicationCategory": "Scientific Software", "operatingSystem": "Windows, macOS, Linux", "softwareVersion": "0.1.1", "description": "R package for applying standardized file naming, directory structure, and mapping conventions to empirical Seed Transfer Zones (eSTZs) in the United States to streamline data sharing among natural resource professionals.", "url": "https://sagesteppe.github.io/eSTZwritR/", "downloadUrl": "https://github.com/sagesteppe/eSTZwritR", "codeRepository": "https://github.com/sagesteppe/eSTZwritR", "author": [ { "@type": "Person", "name": "Brianna Wieferich" }, { "@type": "Person", "name": "Reed Benkendorf", "url": "https://github.com/sagesteppe" } ], "programmingLanguage": "R", "keywords": [ "seed transfer zones", "eSTZ", "empirical seed zones", "native plant restoration", "germplasm", "seed collection", "ecological genetics", "restoration ecology", "spatial data", "R package", "data standards" ], "inLanguage": "en-US", "citation": { "@type": "ScholarlyArticle", "name": "Empirical seed transfer zones require conventions for data sharing to increase their utilization by practitioners", "author": [ {"@type": "Person", "name": "Brianna Wieferich"}, {"@type": "Person", "name": "Reed Benkendorf"} ], "datePublished": "??", "publisher": "??", "url": "https://github.com/sagesteppe/EmpiricalSeedZones/blob/main/manuscript/Empirical-seed-transfer-zones-require-conventions-for-data-sharing-to-increase-their-utilization-by-practitioners.pdf" }, "offers": { "@type": "Offer", "price": "0", "priceCurrency": "USD" }, "sameAs": [ "https://doi.org/10.5281/zenodo.14641975" ] }

Skip to contents

This data set is from Zomer et al. 2022, and modified by sub-setting to the contiguous USA. Zomer, Robert J., Jianchu Xu, and Antonio Trabucco. "Version 3 of the global aridity index and potential evapotranspiration database." Scientific Data 9.1 (2022): 409.

Format

A raster data set

GAI

GAI stored as an integer, needs divided by 10000 to receover decimal places.

Examples

r <- terra::rast(
 file.path(
   system.file(package="eSTZwritR"),  "extdata", 'GAI-cont.tif'
 )
)
terra::plot(r/10000, col = terra::map.pal('ryg'))

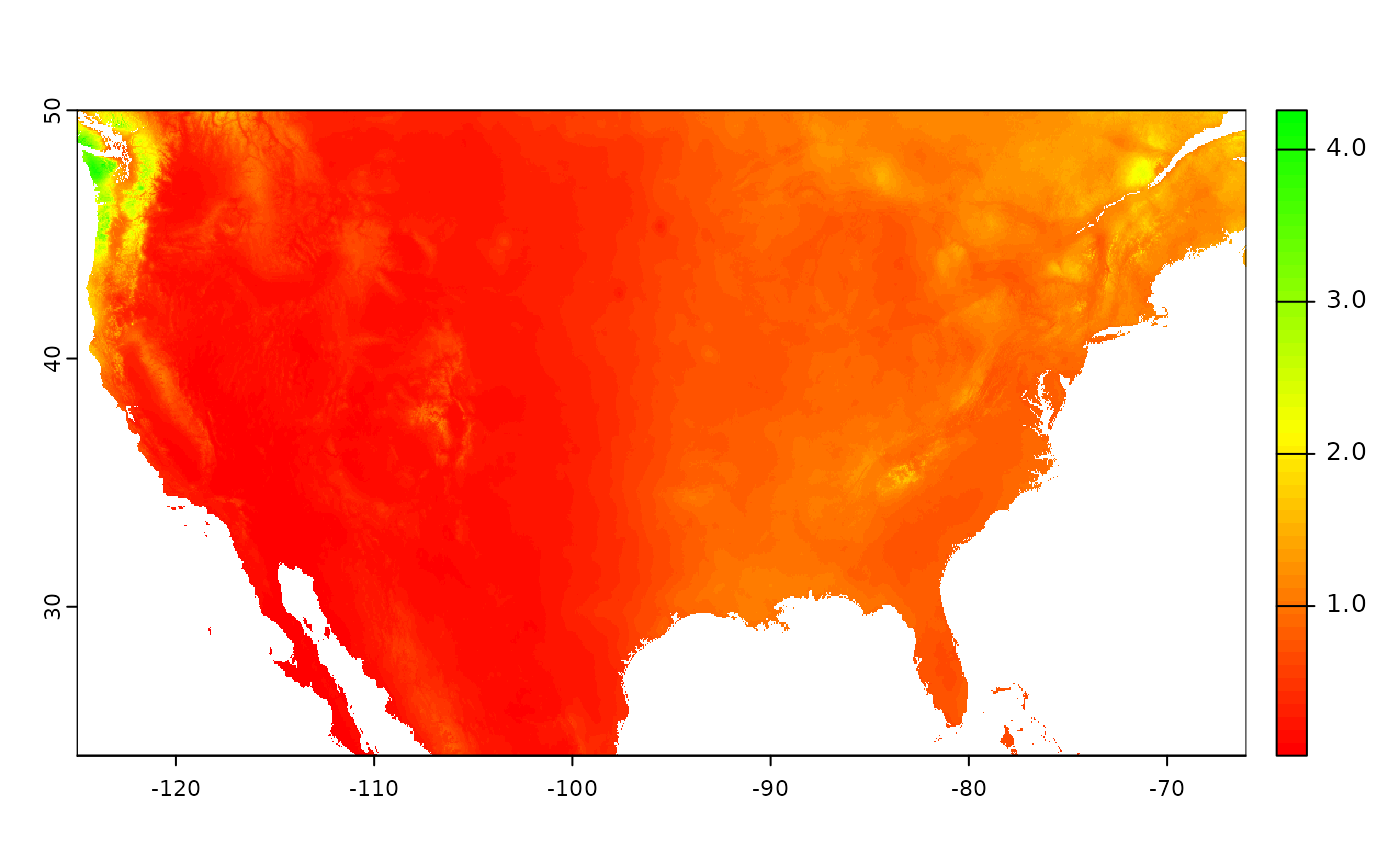
# rainforests swamp the palette!
terra::plot(sqrt(r/10000), col = terra::map.pal('ryg'))

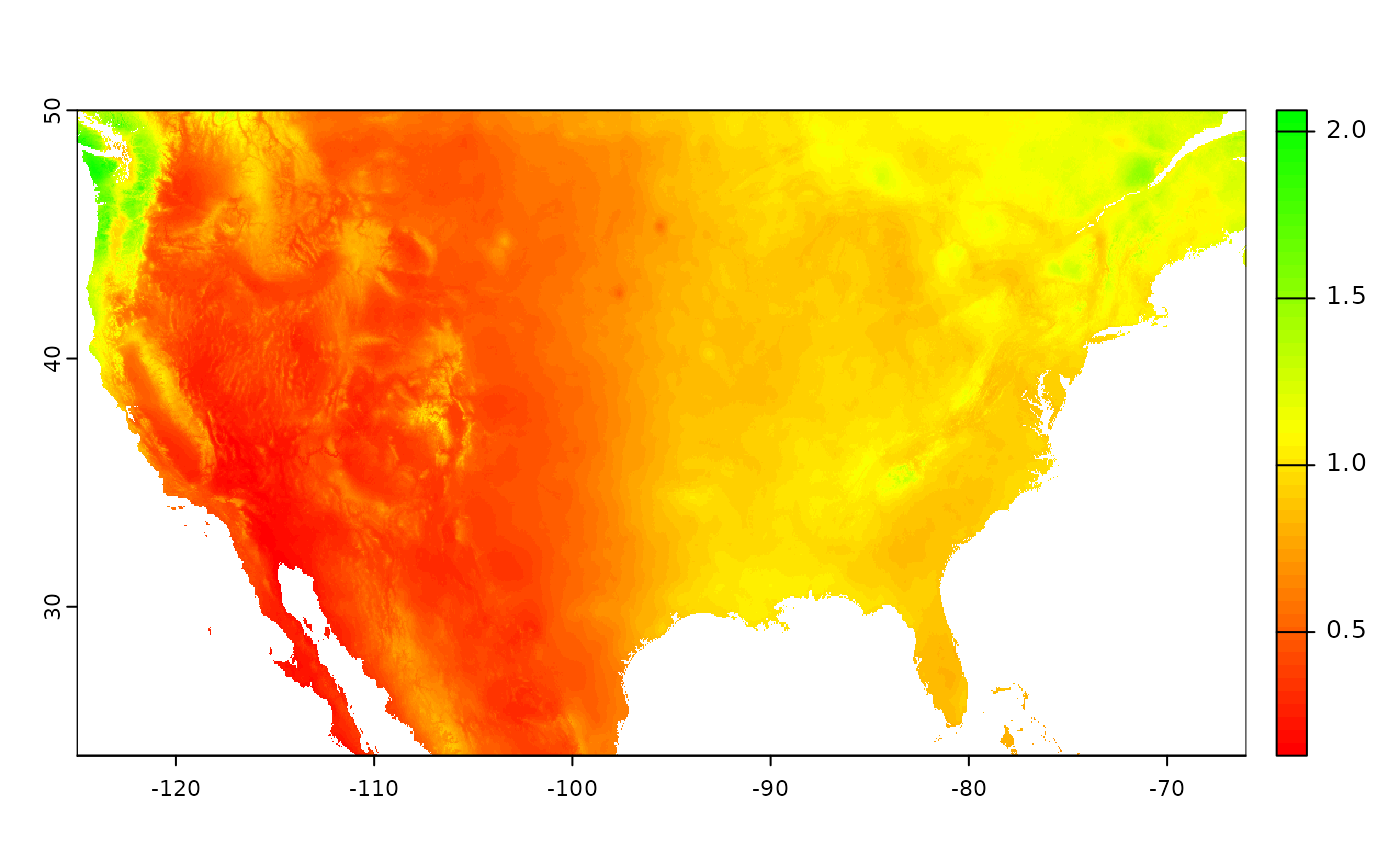
 # better visualization of mid points
terra::plot(log(r/10000), col = terra::map.pal('ryg'))

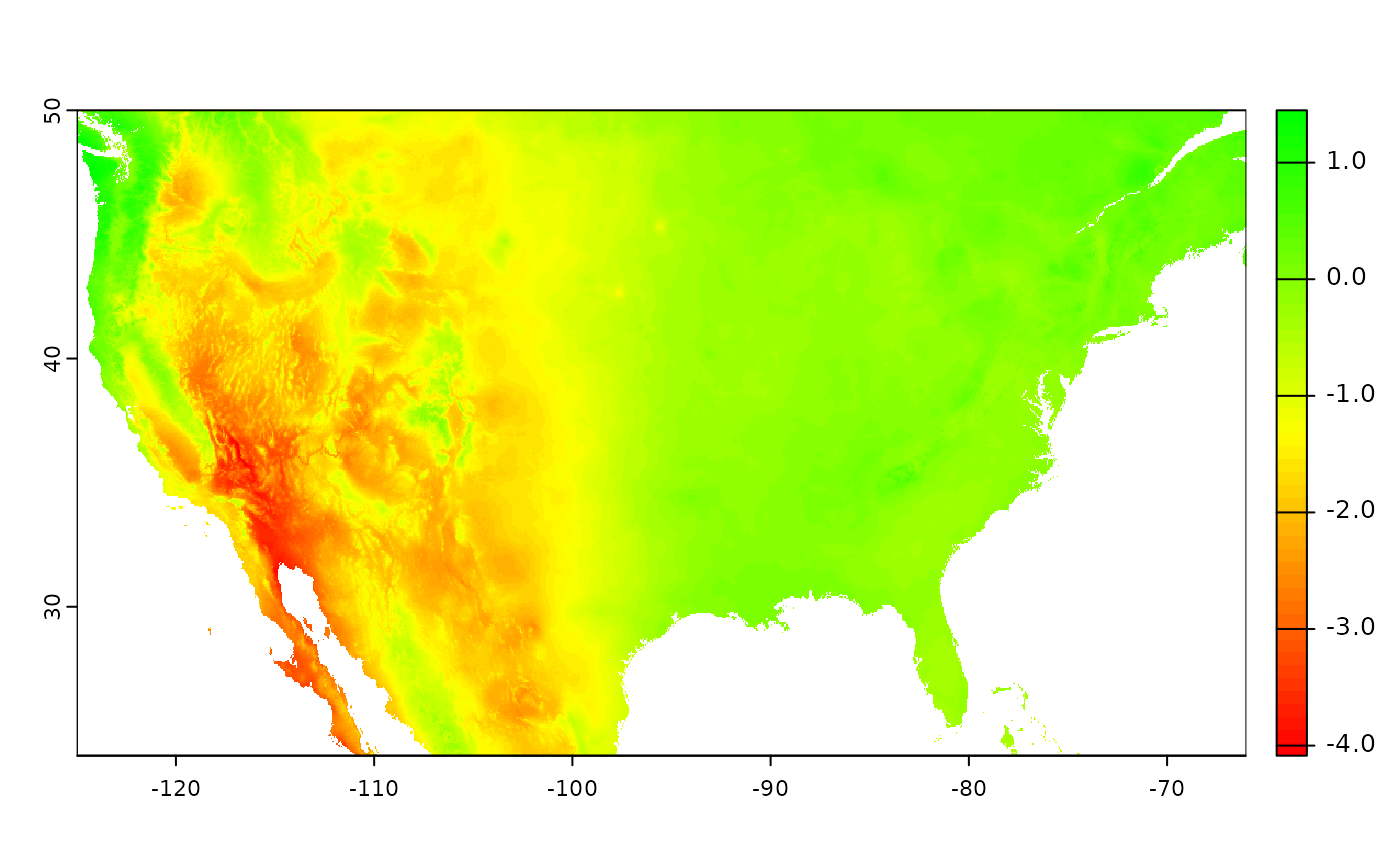
# better vis of low end