Generate a sampling grid based off of regularly sampled points across the species range.
Source:R/PointBasedSample.R
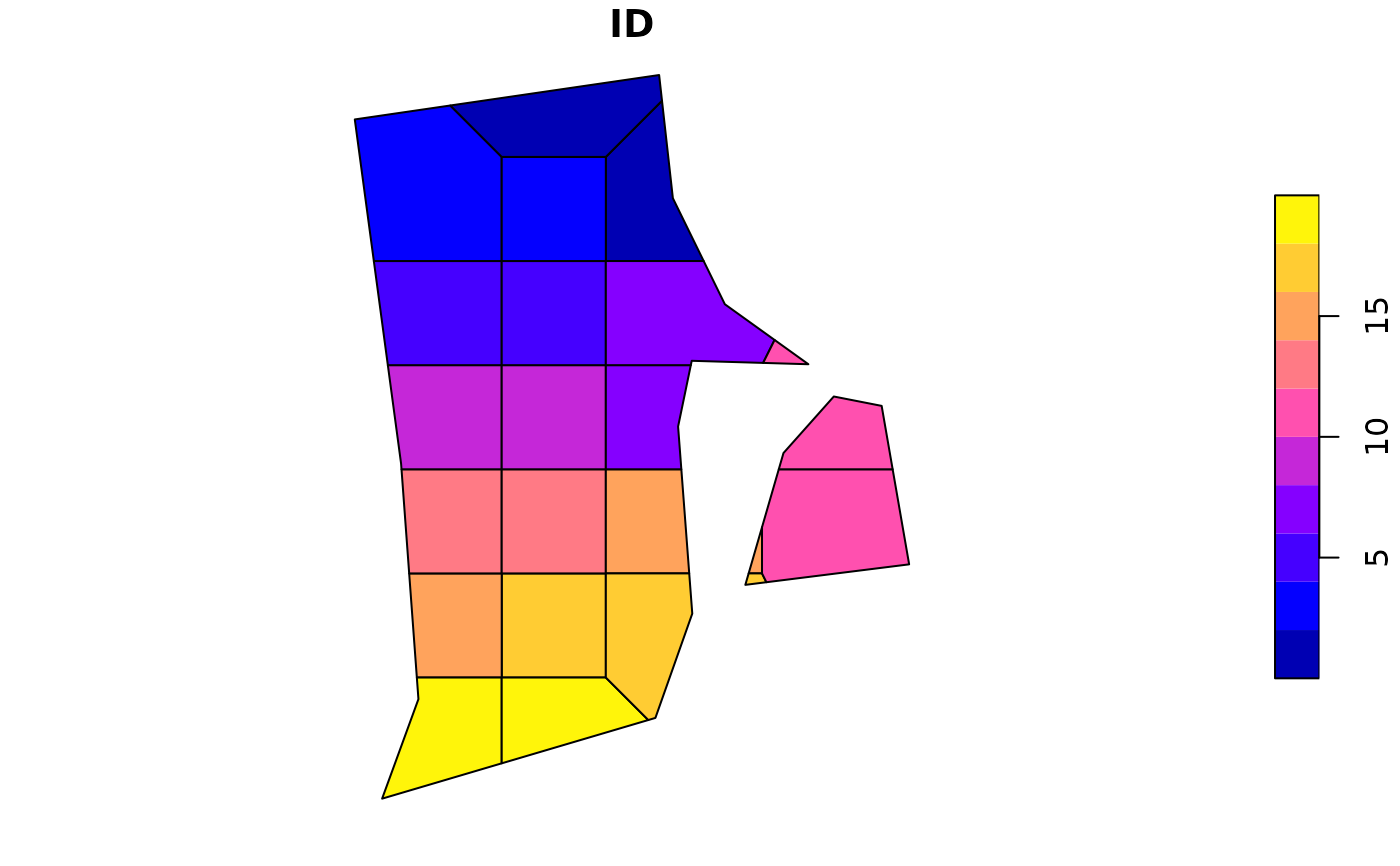
PointBasedSample.RdThis function utilizes a regular grid of points to develop a sampling scheme or n polygons.
Value
A list containing two objects, the first the results of bootstrap simulations. The second an sf dataframe containing the polygons with the smallest amount of variance in size.
Examples
#' Utilize a grid based stratified sample for drawing up polygons
ri <- spData::us_states |>
  dplyr::select(NAME) |>
  dplyr::filter(NAME == 'Rhode Island') |>
  sf::st_transform(32617)

 system.time(
  out <- PointBasedSample(polygon = ri, reps = 10, BS.reps = 10) # set very low for example
 )
#>    user  system elapsed
#>   0.629   0.002   0.631
# the function is actually very fast; 150 voronoi reps, with 9999 BS should only take about
# 2 seconds per species so not much concern on the speed end of things!
head(out$SummaryData)
#>                  Metric   Value
#> 1     variance.observed 9725542
#> 2        quantile.0.001 9757285
#> 3             lwr.95.CI 9725542
#> 4             upr.95.CI 9767454
#> 5    Voronoi.reps.asked      10
#> 6 Voronoi.reps.received       6
plot(out$Geometry)